 |
|
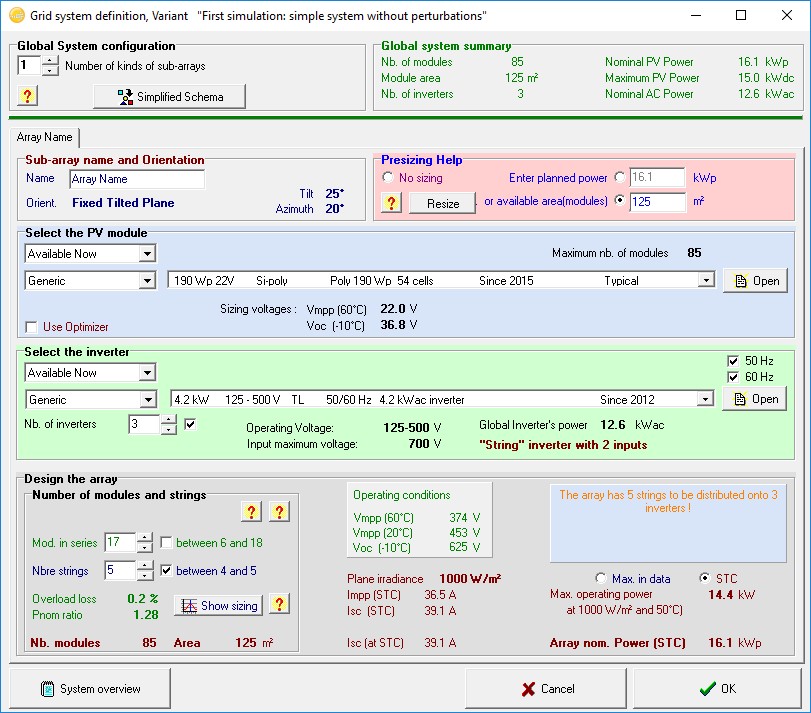
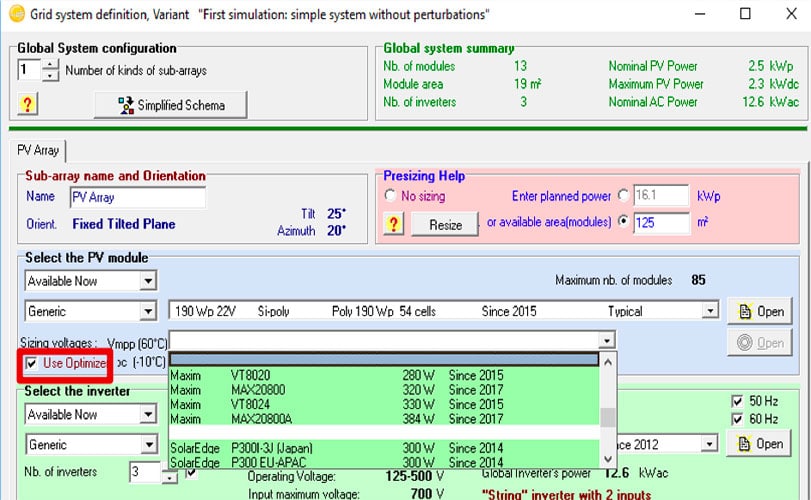
System Design Board
The system design is based on a quick and simple procedure:
▪ Specify the desired power or available area
▪ Choose the PV module from the internal database
▪ Choose the inverter from the internal database
and PVsyst will propose an array/system ▪ configuration, that allows you
to conduct a preliminary simulation.
The software embeds a color-coded warning / errors messaging system. If
there’s a mismatch, issue, warning with your design, you will be warned
within the proper frame. |
 |
|
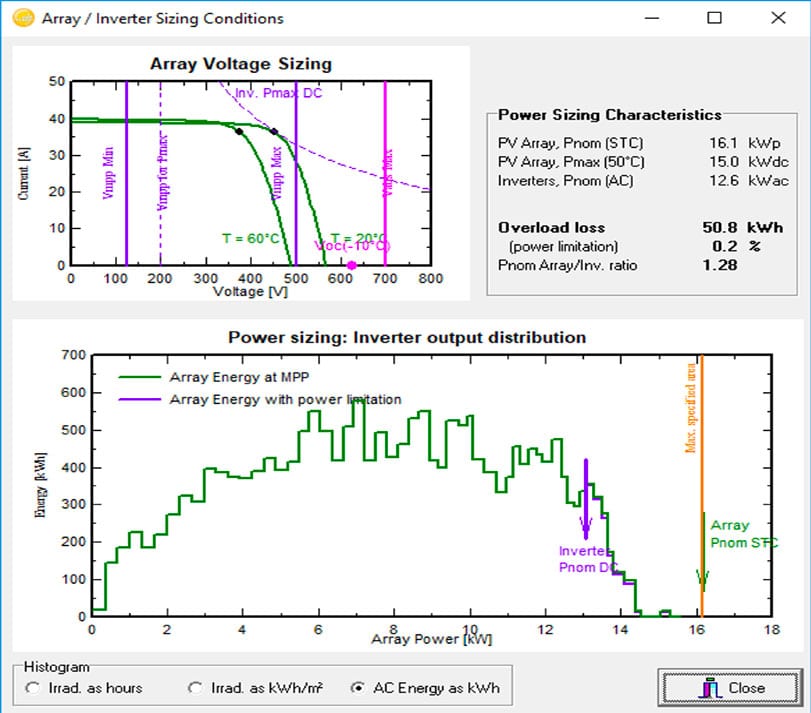
System sizing: Visual tool
A specific tool gathers all constraints for the sizing of the system :
For the number of modules in a series: the upper diagram shows the I/V
curve of the PV array, together with the MPPT range, voltage, power, and
current limits of the inverter.
▪ For the inverter sizing: the second graph displays the annual
distribution of the array power, with the array and inverter nominal
power
▪ The optimal sizing of the inverter is based on the acceptable overload
loss throughout the year. It usually leads to over-size the power ratio
(array nominal power by respect to the inverter nom. AC power), by a
factor of 1.25. After a good system sizing, you can define different
losses like far and near shadings using a full 3D editor for the
definition of the environmental and near shading conditions. Specialized
tools are also provided for the evaluation of the wiring losses (and
other losses like the module quality), the mismatch between modules,
soiling, thermal behavior according to the mechanical mounting, system
unavailability, etc. |
 |
|
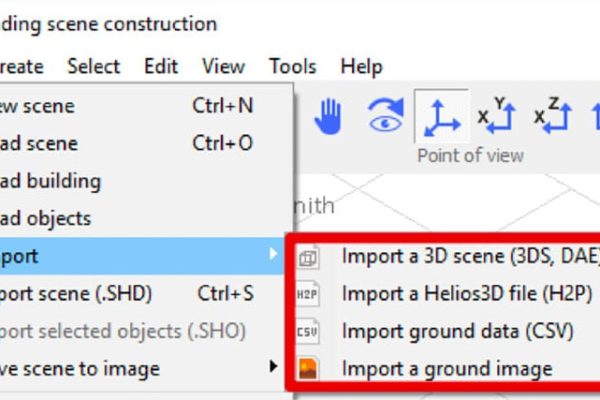
3D Shading Scene
▪ A new “Near Shading Scene” interface is now available.
▪ New layout, close to standards
▪ User Friendly object manipulations and creating
▪ Easy import from external tools such as Sketchup and PV plane
conversation
▪ Orientation identification and Scene validation tools
▪ Sun Point of View Simulation
▪ Multithread shading calculation / simulation
▪ External Shading Scene import from autocad and sketchup |
 |
|
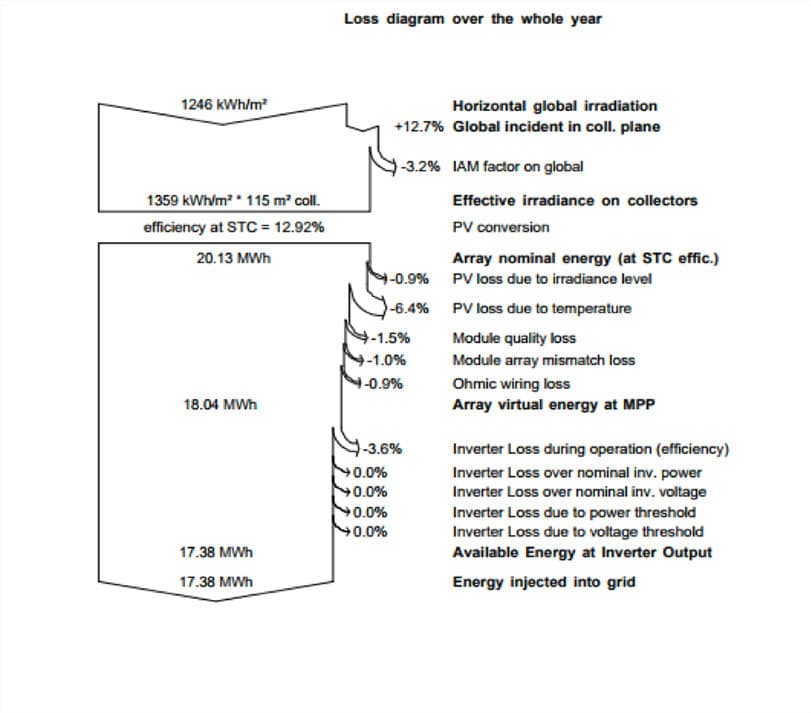
Simulation and results report
The simulation calculates the distribution of energies throughout the
year.
Main results:
1. The total energy production [MWh/y] is essential for the evaluation
of the PV system’s profitability.
2. The Performance Ratio (PR [%]) describes the quality of the system
itself.
3. The specific energy [kWh/kWp] is an indicator of production based on
the available irradiation (location and orientation).
▪ Shows the main energies and gains/losses involved in the simulation,
▪ Powerful tool for a quick analysis of the system’s behavior, and
potential improvements in the design. |
 |
|
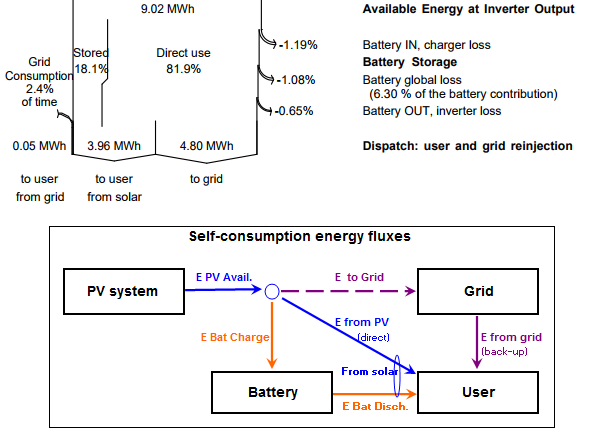
Grid Storage
Storage in a grid system is a complex feature, as it may have different
objectives, which lead to different strategies and different PV system
configurations. Up to now, we have developed 3 strategies in PVsyst:
▪ the storage for enhancing the self-consumption of the PV system owner.
▪ a storage for ensuring peak shaving, when the possible power injected
into the grid is limited.
▪ a storage for the continuity of the user’s electricity feeding, when
the grid is weak and often unavailable.
In each case the energy fluxes are different and lead to different
simulation results.
As an example we show the energies involved in a self-consumption PV
system. |
 |
|
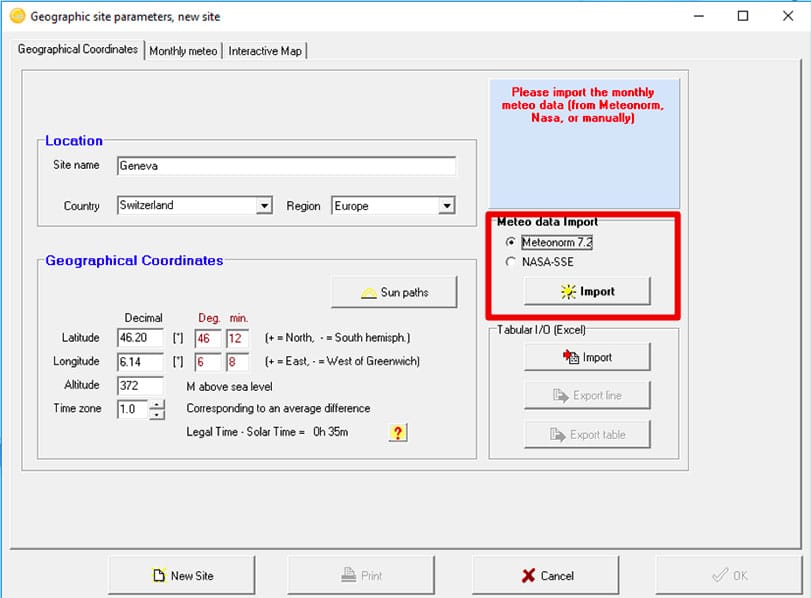
Meteonorm included – 7.2
▪ Direct search for a location using OpenLayers and GeoNames
▪ Full Meteonorm v7.2 interpolation program for any location on earth |
 |
|
PV modules and Model
Management, Inverters
PV modules and model Management
▪ Sandia model implementation and comparison with PVsyst model
▪ Tools for optimization parameters (low-light, I/V curve)
▪ New parameters (tolerance, IAM profile, Vmax UL)
▪ Optimizers (SolarEdge and Maxim)
Inverters
▪ New parameters (Transfo, CEC efficiency)
▪ Multi-MPPT with asymmetric inputs (unbalanced) and advanced Power
Sharing
▪ Improvement of choice by manufacturer |
 |
|
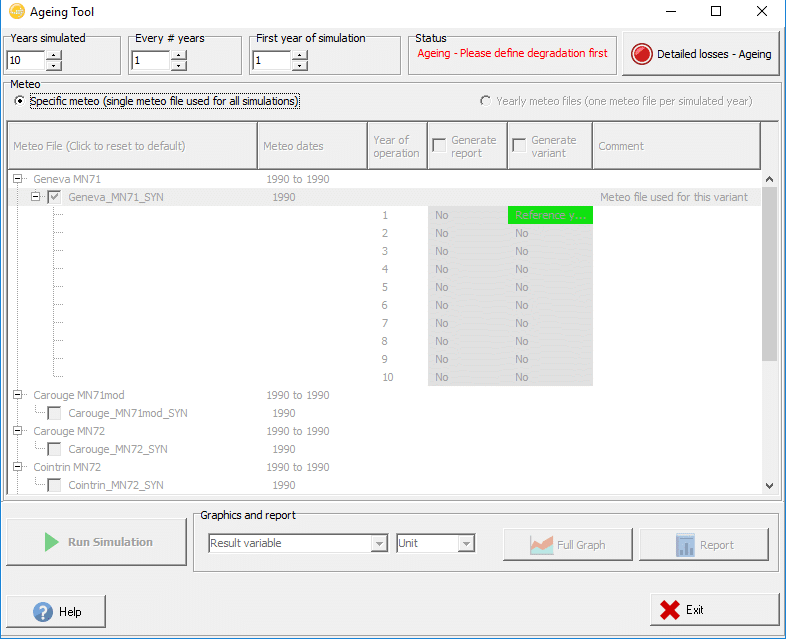
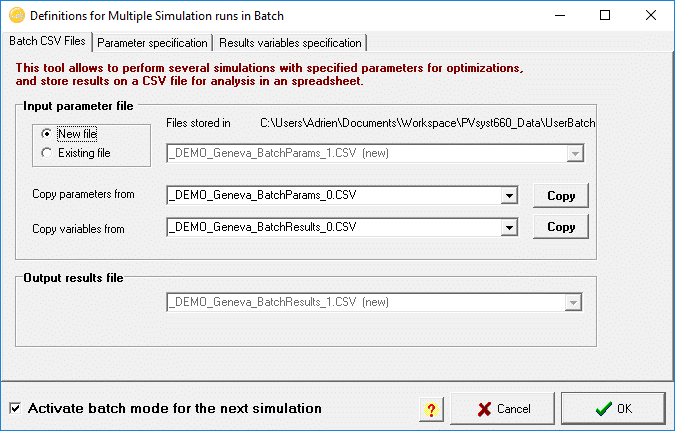
Ageing
Multi-year batch simulation:
▪ For different operating years, same meteo data
▪ For a set of yearly meteo data files
▪ Results and graphs on the report |
 |
|
Novelties
Bifacial model for tracking 1-axis systems (unlimited trackers)
▪ Improved the import parameters from the “real” system defined in 3D
▪ Conceptual error in the model, which lead to an underestimation of the
rear side irradiance by a factor of 1/GCR (i.e. a factor of 2 or more!)
▪ Add the contribution of the Diffuse seen from the rear side.
▪ Albedo in monthly values.Seasonal orientation: possibility of negative
summer tilt for low Latitudes.
Batch mode and sheds optimization tool
▪ Modification of the pitch as parameter
▪ Bi-facial: height above ground as parameter |
| |
|
|