Features
 Compatible
It works in all modern browsers including the iPhone/iPad and Internet Explorer
from version 6. Standard browsers use SVG for the graphics rendering. In legacy
Internet Explorer graphics are drawn using VML.
 Free
for Non-commercial
Free
for Non-commercial
Do you want to use Highcharts for a personal website, a school site or a
non-profit organisation? Then you don't need the author's permission, just go on
and use Highcharts. For commercial websites and projects, see License
and Pricing.
 Open
Open
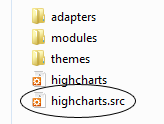
One of the key features of Highcharts is the open source code. Under any of the
licenses, free or not, you are allowed to download the source code and make your
own edits. This allows for personal modifications and a great flexibility.
 Pure
JavaScript
Pure
JavaScript
Highcharts is solely based on native browser technologies and doesn't require
client side plugins like Flash or Java. Furthermore you don't need to install
anything on your server. No PHP or ASP.NET. Highcharts needs only two JS files
to run: The highcharts.js core and either the jQuery, MooTools or Prototype
framework. One of these frameworks is most likely already in use in your web
page.
 Numerous
Chart Types
Numerous
Chart Types
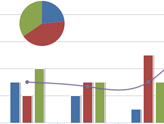
Highcharts supports line, spline, area, areaspline, column, bar, pie and scatter
chart types. Any of these can be combined in one chart.
 Simple
Configuration Syntax
Simple
Configuration Syntax
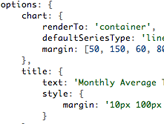
Setting the Highcharts configuration options requires no special programming
skills. The options are given in a JavaScript object notation structure, which
is basically a set of keys and values connected by colons, separated by commas
and grouped by curly brackets.
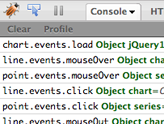 Dynamic
Through a full API you can add, remove and modify series and points or modify
axes at any time after chart creation. Numerous events supply hooks for
programming agains the chart. In combination with jQuery, MooTools or
Prototype's Ajax API, this opens for solutions like live charts constantly
updating with values from the server, user supplied data and more.
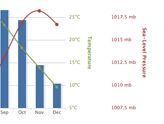 Multiple
Axes
Multiple
Axes
Sometimes you want to compare variables that are not the same scale - for
example temperature versus rainfall and air pressure. Highcharts lets you assign
an y axis for each series - or an x axis if you want to compare data sets of
different categories. Each axis can be placed to the right or left, top or
bottom of the chart. All options can be set individually, including reversing,
styling and position.
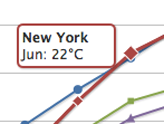 Tooltip
Labels
Tooltip
Labels
On hovering the chart Highcharts can display a tooltip text with information on
each point and series. The tooltip follows as the user moves the mouse over the
graph, and great efforts have been taken to make it stick to the nearest point
as well as making it easy to read a point that is below another point.
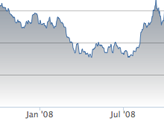 Datetime
Axis
Datetime
Axis
75% of all charts with an X and Y axis have a date-time X axis. Therefore
Highchart is very intelligent about time values. With milliseconds axis units,
Highcharts determines where to place the ticks so that they always mark the
start of the month or the week, midnight and midday, the full hour etc.
 Export
and print
Export
and print
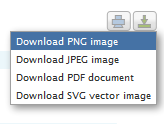
With the exporting module enabled, your users can export the chart to PNG, JPG,
PDF or SVG format at the click of a button, or print the chart directly from the
web page.
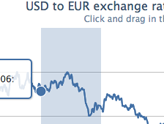 Zooming
By zooming in on a chart you can examine an especially interesting part of the
data more closely. Zooming can be in the X or Y dimension, or both.
 External
Data Loading
External
Data Loading
Highcharts takes the data in a JavaScript array, which can be defined in the
local configuration object, in a separate file or even on a different site.
Furthermore, the data can be handled over to Highcharts in any form, and a
callback function used to parse the data into an array.
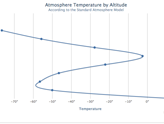 Inverted
Chart or Reversed Axis
Inverted
Chart or Reversed Axis
Sometimes you need to flip over your chart and make the X axis appear vertical,
like for example in a bar chart. Reversing the axis, with the highest values
appearing closest to origo, is also supported.
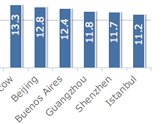 Text
Rotation for Labels
Text
Rotation for Labels
All text labels, including axis labels, data labels for the point and axis
titles, can be rotated in any angle.